What you see here is the log in page for RPI’s Yoga software. I’m going to log in with an account we have set up. This authenticates off of our internal perceptive content environment. And when I log in you will see a short loading screen. Yoga does cache a few things so that the user experience is very speedy and responsive once the user is in. And you’ll see that the first thing that loads up is the Yoga dashboard. This is a new feature that we’re very excited about. This is giving us a quick snapshot look at our workflow. And instead of going through an integration server to fetch data, this actually going directly to the database so that we can formulate this data however we want.
To walk through what is on the screen here. There’s a list of workflow queues. This is actually looking for documents in every queue inside of the whole process. It only lists queues though that have documents inside of them. So there are a number of empty queues that don’t have any documents. Next it lists the documents in the queue, the total number of documents, then the oldest document by created date. Then it provides a breakdown of those documents by day groupings. 0-5, 6-10, and 10+ days, and then the oldest invoice date in that queue since this is an accounts payable workflow. However, there are other columns we can add. Virtually any piece of metadata on the document could be added. For example, we have built this dashboard to also include a total of invoice amounts in the queue in the past. Next, the next great feature of this dashboard is that we can actually click on the queue detail or the number of day breakdowns to get that information.
So if I look at my AP detail entry queue and I click that it actually will pop up another window showing the information, the document detail information on the queue. Next, I can go to the day breakdowns here and click on that. Same thing for AP detail entry and see just those documents. When it gets to a large number of documents in a queue, this is gonna be very beneficial to be able to quickly see a snapshot of just the information you wanna see. Generally, the oldest documents in a queue. And this is not limited to any sort of view amount. View’s typically limited to 500 maybe as much as 2000 documents. This will actually pull back every single thing in a queue. Another great feature is that I can actually use the button up here, display all data, to see every single row of data that is going into this table. So if I click display data it will actually show me and this is paginated, which I can increase this but ten results per page show me every single thing inside of workflow that’s configured to show in this dashboard.
And even better, let’s say I wanna actually search through all this data. It says there’s 44 entries. So I’ve actually got a column set up over here to indicate who the current approver is if the documents in approvals. So let’s say I wanna see everything that’s with the current approver, AP approver 1, which is an approval count I have set up. I start typing and it quickly starts filtering down all the results to show me this document right here and I can see that I have a couple different approvals pending for these two specific invoices. So if I back out of that search criteria, I can actually export all of this data to CSV, which then allows me to open that inside of Excel and filter and pivot that data to my heart’s content. We don’t wanna try and re-create every cell features so we just give you the ability to take this data and throw it into Excel.
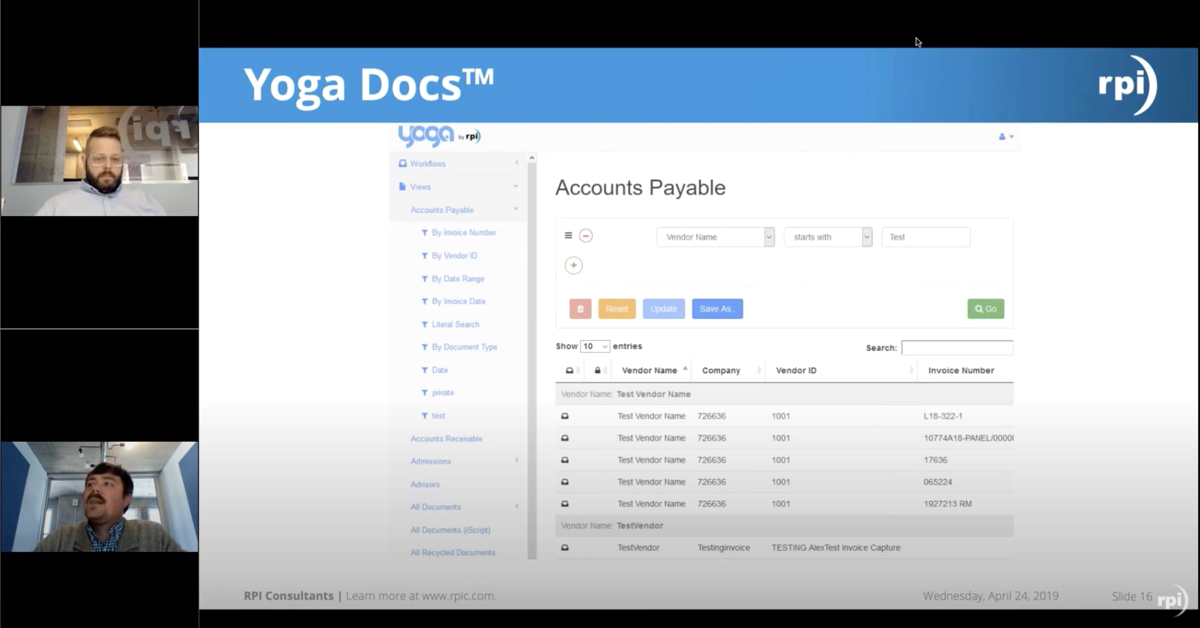
Now this is just one example of how the Yoga dashboard can be used. However, there’s a lot of different information and columns that we can add to this and other data that we can report on. So really this can be catered to your environment and your specific use case. The next feature I’d like to show are views and filters. Now I’m going to expand this views button over here and you’ll see that we have the accounts payable view that was built inside of perceptive concept listed here and this view will put back all the invoices available up to the maximum number of entries just like inside of the thick client. However, now inside of Yoga we can build filters to allow us to quickly search through all of this data. I have a filter saved here called Computer World Invoices, this is searching by a vendor ID as if I needed to quickly recall these documents often in my day to day. So I click on that and hit go and it retrieves all of the documents that match that information and in this case it’s this vendor ID field, which is field two, is equal to 1003.
And from here, of course, I can review the information on the line items. I see that one of these documents is in task pending, which I know to be inside of approvals. So I can actually open the document and review the information. I can also save or update these filters. So let’s say I wanted to change this to be for a custom property, vendor name. And I wanted it to be equal to Comtron, another vendor that I have to look for frequently. I hit go to make sure that my filter works and look at that, it retrieves six entries, another series of invoices at different stages inside of my accounts payable process. I’m gonna go ahead and save this as a new filter, so I save it as Comtron Invoices. I create it and it is now referenceable over here on the left underneath accounts payable.
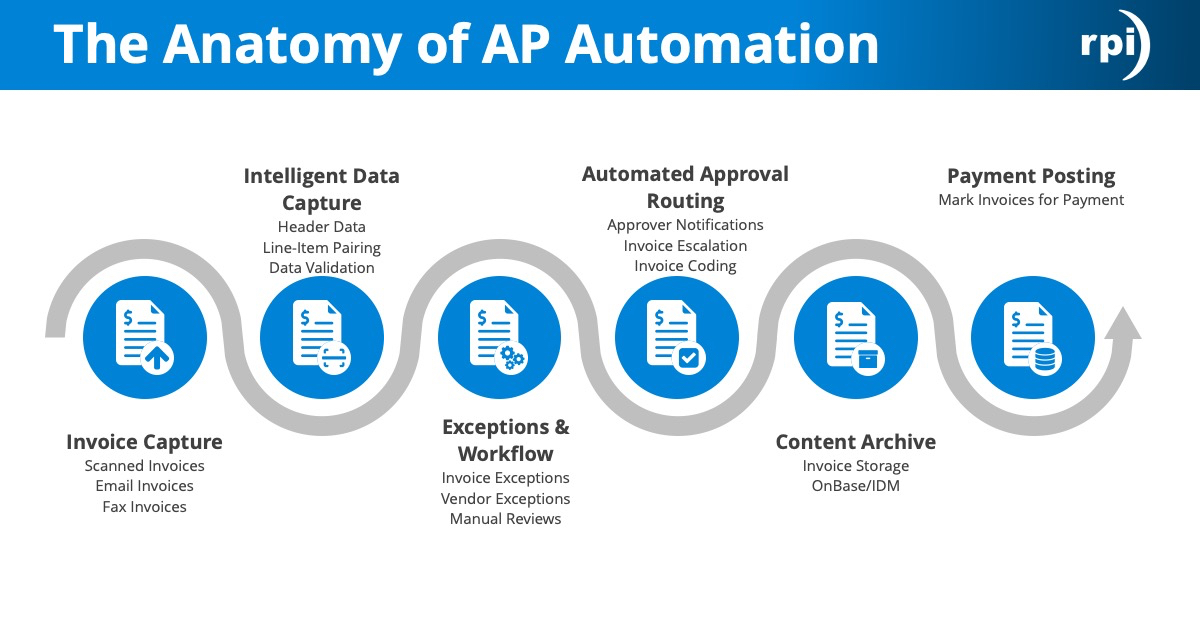
The final thing I’d like to demonstrate is the capability to perform your work flow actions inside of Yoga. I’m gonna close up views here and go over to my workflows. Expand accounts payable and the first thing I’m gonna do is check my header entry queue for any data that needs to be entered. First thing I’m gonna do is open this Comtron Invoice here. You’ll see I have my thumbnails over on the left side, my image here in the middle and then my properties here on the right, including my custom properties at the bottom. I have another tab here for my forms and of course we have our APE form which loads up. I can perform all my data entry here and now this one’s already filled out as if it had gone through perhaps my OCR but I can, of course, enter additional comments or make any changes that I might need to. I can click validate, which will perform validation checks already built into the form. For example, if I don’t have an invoice amount it will tell me that, that’s missing.
And after I validated everything I will choose to save in route so this will actually route the document to the next step in the workflow process. Okay. Then and then you’ll see that it has disappeared. Then maybe I wanna hop over to my AP exception queue to do review an exception document. I’m gonna open up this Striker Spine Invoice and I’m gonna review the properties on it. I know that the wrong PO number is listed here on this document as I use my magnifying glass so I’m actually going to leave a sticky note. And I might leave a note that says, “PO number is invalid. Please provide correct PO number.” I’m gonna add that and I’m going to actually move that sticky note up there. And I’m actually gonna send this over to our purchasing department so that they can provide the correct PO number. I’m gonna click save and route and send to purchasing.
So this has been a quick demonstration of the major functionality of Yoga. I’m not gonna get to everything. You can also approve or reject tasks, perform approvals. You can export documents. There’s a lot of other functionality here. If there’s any specific functionality you are looking to see a demonstration of, please reach out and we’ll set up a demonstration for you. Thank you.


