
The Infor GL Report Designer continues its steady march forward, and if you haven’t checked in on it lately, it may be time for another look.
Since its April 2023 release, GL Report Designer has matured into a highly capable financial reporting tool with enhancements that bring more flexibility, better formatting options, and easier enablement to organizations seeking greater visibility into their financial performance.
Whether you’re building income statements, balance sheets, or budget vs. actual reports, GL Report Designer has never been better.
In this post, we’ll explore some of the latest updates to GL Report Designer, what they mean in practice, and how we’re leveraging them today with clients who rely on fast, accurate financial insights.
More Power at the Column Level
One of the biggest enhancements made to the GL Report Designer is more control over how data is filtered and calculated within columns. It’s now possible to filter columns by summary accounts, departments, or any other user-defined dimension.
Even better? Filters can be combined within a single column, giving report builders highly granular control over what gets included.
For example, you might build a column that totals YTD balances for a subset of departments, or one that compares beginning vs ending balances across a specific period. Each column can also be configured to calculate period totals, YTD, or LTD figures, giving teams the flexibility to design the view that makes the most sense for their audience.
Calculated columns have also gotten more useful. Now, teams can define columns that perform common comparative operations like budget-to-actual, variance percentages, or combined account totals.
These enhancements bring a level of customization to GL Report Designer that used to require custom coding, but no more!
Layout & Presentation Enhancements
While GL Report Designer’s core function is data presentation, recent updates have made strides toward improving the visual experience of reports. A small but helpful feature, page numbering, was recently added.
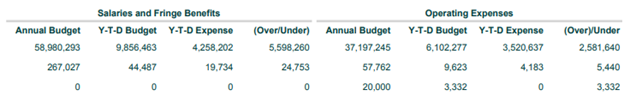
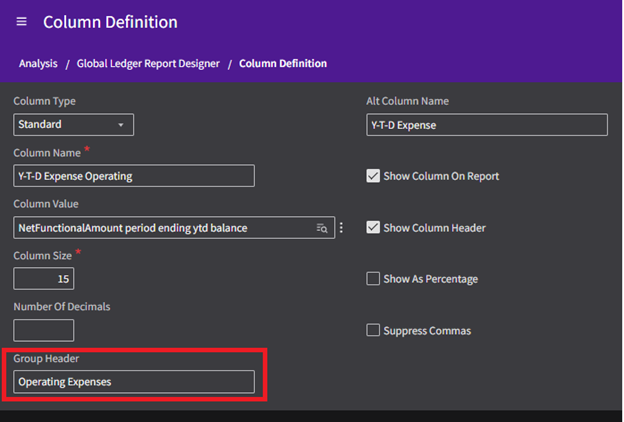
But more impactful is the introduction of group headers, which allow report designers to logically group multiple columns under a single labeled header. This is especially helpful for reports that include multiple views (e.g., current period, prior year, and variance side by side) and need clearer delineation.
As formatting becomes more important for executive- and board-level audiences, we’re also seeing renewed appreciation for features that have been around for some time, like composite reporting.
Though not new, composite reporting is increasingly valuable for modern workflows. It allows multiple GL Report Designer reports to be combined into a single, cohesive output, reducing manual consolidation and ensuring consistency across recurring financial packages.
When paired with Birst formatting, composite reports help teams deliver polished, board-ready financials with far less overhead, but more on that below.
Birst-Backed Formatting for a Professional Finish
Behind the scenes, GL Report Designer leverages Infor Birst. That means for clients who want more control over the formatting and styling of their reports, this opens up some powerful opportunities. A skilled Birst developer can access the underlying report and enhance its visual layout far beyond GL Report Designer’s standard interface.
We’ve helped several of our customers who needed to generate polished, presentation-ready reports for county commissioners. GL Report Designer alone couldn’t provide the level of formatting detail they required.
But by combining GL Report Designer’s data-building capabilities with Birst’s formatting engine, we were able to recreate their legacy reports with the exact layout they needed. The result? Saving countless hours compared to building those same reports from scratch in Birst or App Studio.
Best Use Cases & Long-Term Outlook
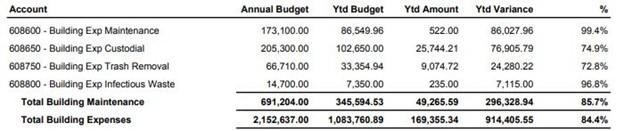
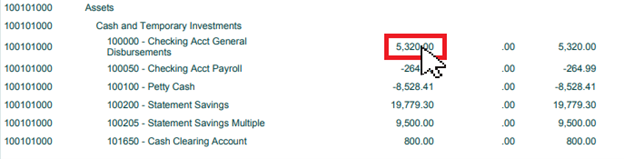
GL Report Designer shines when used for GL total-based reports like income statements, balance sheets, and budget-to-actual comparisons. It’s not built for transaction-level detail, but some reports can be configured with drillable views, giving users access to underlying details when needed.
And just as important, it’s a tool that clients can activate post go-live with minimal configuration. We’ve seen that most finance users manage their own report edits and new builds, a huge advantage over solutions that require developer involvement for every change.
Compared to out-of-the-box business intelligence FSM reports, GL Report Designer is simply more flexible, more user-friendly, and better aligned with how modern finance teams want to work.
Infor seems to recognize this too, and we expect continued investment in GL Report Designer as a preferred financial reporting tool for Infor CloudSuite users.
Get Help with GL Report Designer
For many organizations, GL Report Designer now offers the right balance of power, flexibility, and ease-of-use. When paired with Birst formatting and a thoughtful enablement strategy, it can cover the majority of your core financial reporting needs.
If your team is still struggling with limitations or investing too many hours building custom reports in App Studio or Birst, GL Report Designer may be the upgrade you’ve been waiting for.
Need help getting the most out of the tool? RPI can help. From initial design through enablement and formatting, we can help you get set up with fast, accurate reports that scale with your business.
To learn more about the latest developments to GL Report Designer, register for our upcoming webinar below.