
In April, Infor made available the GL Report Designer for financial use cases, laying the foundation for advanced reporting capabilities for years to come.
The release arrives at a good time too, as we’ve heard from clients and prospects alike that there has been an operational reporting gap for finance and accounting. The launch of this tool demonstrates Infor’s commitment to better serving their customers while also empowering their partners to do the same.
So, what exactly is the GL Report Designer and how can organizations make use of it? Below we explain what the tool can do, outline four simple steps for getting started, and provide examples of common use cases.
What is Infor’s GL Report Designer?
The GL Report Designer is an Infor tool that allows business users to create ad-hoc financial reports that capture general ledger data and information. At a high-level, the report designer allows:
- Staff accountants to independently create reports without relying on system administrators
- Analysts to determine the frequency of refreshing financial data in reports through columnar replication sets
- Business users to share and distribute reports for collaboration using standard Landmark functionality
In other words, GL Report Designer is a standard finance reporting application with usability targeted for a staff accountant. It enables users to define and run general ledger reports without having to allocate IT resources.
The reports follow your financial enterprise group (FEG) hierarchies and perform calculations or comparisons using the native finance and supply chain management interface. Like other Landmark CloudSuite reporting tools, GL Report Designer follows standard sharing and distribution functionality, which can help various business users across the organization in creating reports when they need them.
Below we discuss the two roles your organizations can assign for ensuring collaboration and visibility into the various GL Report Designer functions.
GL Report Designer Security Roles
The GL Report Designer has two levels of security: power user and view only. And the security role assigned determines access to the application.
Power user: This profile has full access to all of GL Report Designer’s capabilities. Individuals with this security level are typically reserved for application administrators, controllers, staff accountants, and financial business analysts. These are the folks who will be using the tool to build, configure, and disseminate reports.
View-only: As the name suggests, the view-only security level has limited GL Report Designer access. Individuals with this view-only privilege can inspect dashboards and run reports. Budget analysts, chief financial officers, financial viewers, budget controllers, financial processors, and project managers often receive the view-only security level capabilities.
These example security role assignments are recommendations. Organizations are encouraged to use their own discretion to assign custom security roles outside of the job roles above. For instance, a budget analyst could be assigned the power user role. RPI Consultants can help you establish a system for assigning roles as well, in addition to helping you create custom reports.
Getting Started with GL Report Designer
Now that the tool is available in every Infor-ERP organization’s tenant application, users can create financial reports in four simple steps.
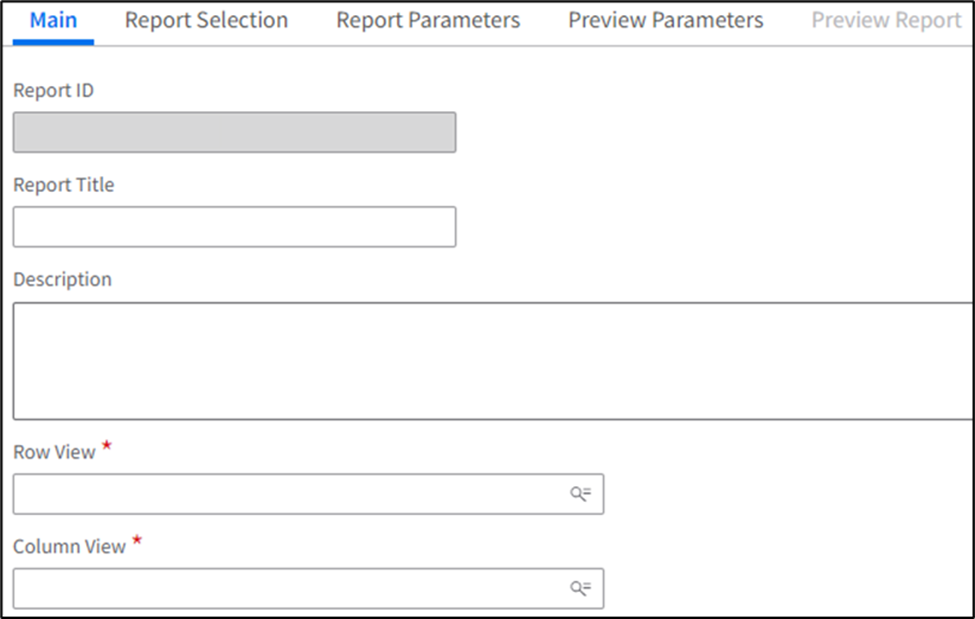
Step 1. Create a Row View: During this step, users can customize how they would like the data to display in the report. By navigating to the “Row Views” column in the tool, individuals can configure which rows to include as well as their order. Select the relevant FEG, customize the data ordering, and click “Save.” Only one row is required per report, though you can add more depending on your specific needs.
Take for example if you want to break out dimension data for both your “Cost Center” and “Chart of Accounts.” By adding a row for each, you can compare finances across the two functional areas.

Step 2. Create a Column View: When creating report Column Views, you will first be prompted to input whether the data is being pulled from source information or if it is a new calculation. Choose the relevant selection and then name it accordingly.
One key difference between creating a Row View and a Column View is that a Column View requires building each column individually. For example, if you’re building a report that displays “Budget,” “Actuals,” and “Variance” for a particular functional area, you will need to create a column for each of these. Whereas with the Row View creations, you select the Chart of Accounts, and it will populate all the data within that source.

Step 3. Combine Views: During the combine phase, business users must create the report, name it, and select the relevant Row and Column Views. Individuals can also customize the report parameters, sections, and previews if they wish to.
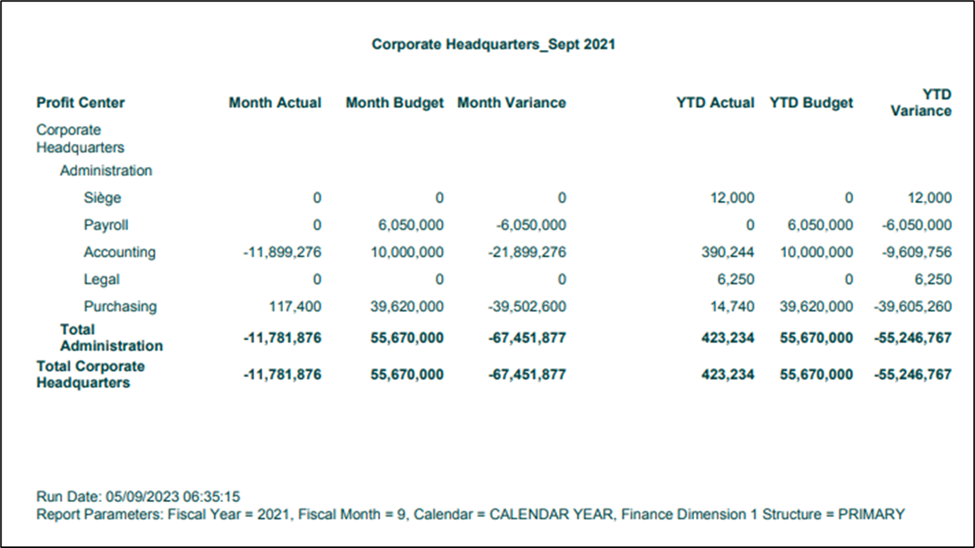
Step 4: Generate, preview, and run: It’s now time to create your report leveraging the Row and Column parameters you identified in the previous steps. Think of generating as creating the outline, and running as executing the build. The preview functionality provides a look at what the report will look like before running it. These three similar sounding steps ensure the report you’re about to create is exactly what you intended for.
Common Use Cases for GL Report Designer
Now that you understand the basics for creating a report using GL Report Designer, it’s important to see how the tool can empower various personas with generating valuable financial and accounting insights.
With its ease of use and functionality, organizations can quickly identify key trends and patterns regarding their financial wellbeing. Below are just three common reports users can create with the GL Report Designer.
Balance sheets: Balance sheets depict snapshots of your financial wellbeing at a moment’s notice. This invaluable report can help a great deal with assessing your organizations’ stability, liquidity, and solvency, as well as performance in various business areas. Beyond financial insights, balance sheets are effective in demonstrating compliance with various accounting standards, such as Generally Accepted Accounting Principles.
Income statements: Income statements, also known as profit and loss statements allow you to quickly review your organization’s financial status. With GL Report Designer, your organization can create summaries of revenue sources and expectations. Armed with this information, executives and accountants alike will be able to evaluate areas of profitably and if necessary, implement cost control measures.
Trial balances: GL Report Designer can also create trial balances. This critical document ensures general ledger accuracy by identifying errors and discrepancies reported. For example, if services rendered to Patient A for $1,000 are recorded in the journal but not posted to the revenue account, the revenue side of the trial balance will be $1,000 short. This discrepancy can be identified through the trial balance sheet and provides organizations with an opportunity to rectify any accounting errors.
Get Help with GL Report Designer
While the news of the GL Report Designer is exciting for financial users, it’s not without its limitations and challenges. The designer is only capable of reviewing total and balance data and does not currently allow transactional data for reporting purposes. Rest assured that future functionality and developments are on the way and expected in October 2023.
Still, Infor has done an excellent job of enabling partners like RPI to help clients with their financial and accounting reporting requirements. GL Report Designer is a great tool, and we can help you make the most out of its many capabilities.
Contact RPI Consultants now to learn about a special training we’re offering, which includes a remote four-hour training session and 40-hours of on-call support for report building.
Using your live data, our experts will train your staff and create essential reports that you can begin using immediately. Contact us below to learn more about the offering and how RPI can help you with financial reporting.