OnBase’s Unity Client simplifies access by using the familiar UI found in the Microsoft Office suite, giving users the ability to connect custom SQL databases to role-based dashboards with ease.
It’s a practical way to see the value Unity Client dashboards bring to teams. Once deployed, dashboards surface real-time KPIs through dynamic tiles, charts, and grids, giving users a comprehensive but digestible view of their data.
The Dashboards also support role-specific permissions for controlled visibility. Administrative users maintain full control over permissions and configurations, while end users are limited to execute-only access, ensuring departments see only the productivity data relevant to them.
By replacing static spreadsheets and manual reporting with custom dashboards inside the Unity Client, organizations gain clearer visibility into indexing performance, increase accountability across teams, and lay the groundwork for long-term operational success.
In the demo below, Principal Consultant Cailen Myers walks through the dashboard configuration process, including how to execute a tailored SQL query using runtime parameters such as user group and date range.
Check out the detailed video below or keep reading for the step-by-step guide.
Step-by-step Guide:
1) Log into Test First:
Access the OnBase Unity Client (test environment) to safely build and validate your dashboard before moving to production.
2) Open Reporting:
From the Unity ribbon, select Reporting.
If it’s not visible, confirm your Reporting Dashboards license and security permissions.
3) Go to Administration
In the Reporting module, select Administration.
Build in order: Data Provider first, then Dashboard, then (optionally) Categories.
4) Create a New Data Provider:
Under Data Providers, select Create New Data Provider.
Name it clearly (best practice: match the dashboard name).
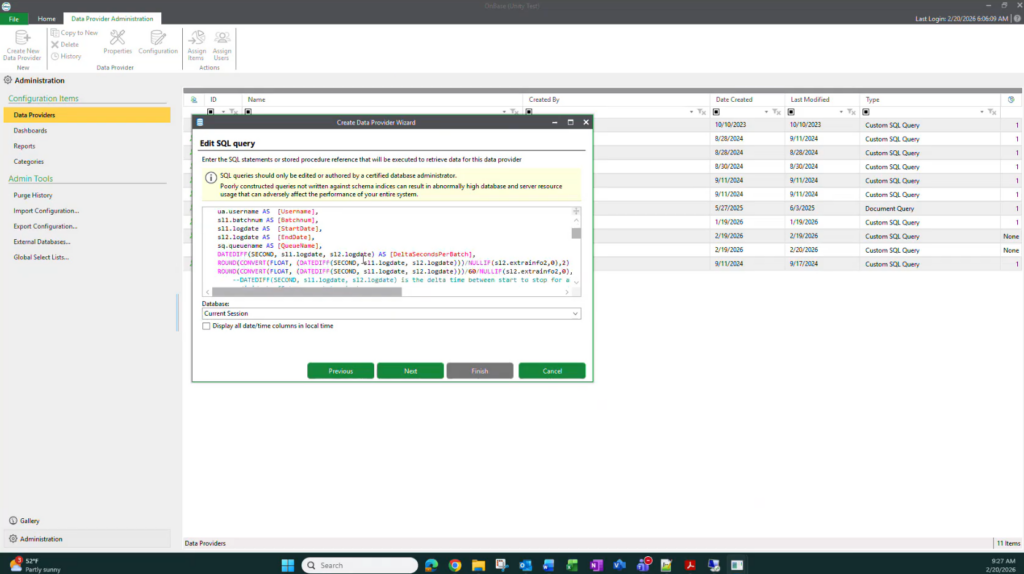
5) Select Custom SQL Query:
Choose Custom SQL Query and paste in your prepared SQL.
Proceed using the current session database.
6) Configure Runtime Prompts:
Enable runtime prompting and configure:
- User Group (populated via SQL select list)
- Date/Time Range (so users define reporting window)
- Set default values for testing
7) Assign Data Provider Access:
Grant yourself/admins Full Control while building.
Add business users later with Execute-only access.
Finish the Data Provider.
8) Create the Dashboard:
Under Dashboards, select Create New Dashboard.
Name it (matching the Data Provider), add a description, and link the Data Provider.
Set permissions (typically Read-only for users, optional export access for managers).
9) Design the Dashboard:
In the Dashboard Designer:
Add a Chart for key totals (pages/documents indexed).
Add Cards for summary metrics (total pages, documents, batches).
Add a Grid for detailed per-user results.
Create Calculated Fields for productivity metrics (time per batch, pages per minute).
Rename items for clarity and adjust layout for readability.
Save and close.
10) Publish & Run:
Return to the Gallery, locate the dashboard, and run it.
Users will be prompted for User Group and Date Range, and the dashboard will populate with charts, cards, and grid results.
Get Help with Building Dashboards in OnBase
Role-specific dashboards offer teams greater visibility into their respective business areas, while still safeguarding critical information. If your teams have complex needs or require additional support in creating and managing dashboards, contact RPI Consultants below to learn about our services.