Alex Lindsey:
Hello and welcome to another Webinar Wednesday with RPI Consultants. Today we’re going to be talking about accounts payable reporting. A few things to know. There’ll probably be some construction workers walking in behind me and that may have something to do with a background noise you may hear. But progress can be noisy and pardon our dust while we process forward.
A few housekeeping items to take care of today. This Webinar will be recorded. We’re going to send out a PowerPoint slide to all the attendees after this. This video will also be posted to be shared at a later date as well. If you have any questions throughout the Webinar, please feel free to post those into the Webinar chat channel and we’ll try to answer those at the end of the meeting and if you have any other topics that you’d like us to cover or like us to explore, then we’d be happy to do that as well.
So getting started here, this is the last Webinar of the day. We do have another two, big surprise, coming up next month. Wednesday, May 1st, 2019 at 11:00 AM we’re going to be covering how you can evaluate API or other third party workflows for invoice processing. So if you don’t have anything in place now maybe it’s a good opportunity to explore that.
And we’re also going to be talking about visual basic, VB, scripting for Perceptive Content. There’s a lot of fun things you can learn. So if you are an admin that’s looking to expand some of your skills, I think that’s a really good one to attend as well.
My name is Alex Lindsey. I’m a senior solution architect with RPI consultants. I have over six years’ experience working in the content management OCR extraction or advanced data capture, as I’m constantly told to say. Basically, software sphere. I specialize in accounts payable and other random solutions that you may want to incorporate or automate and I am a master whiskey distiller.
So a few things on the agenda today. We’re going to talk a little bit about RPI Consultants and what we do, what we offer. Very small AP reporting overview. And then we’re gonna run through a bunch of common AP reports that we see and that we’d like to report on for our AP automation solutions. And then we’ll close it up with some of the reporting tools and software that either maybe you have now or maybe you are exploring for future software enhancements or future software needs. And then we’ll open it up for questions and summary.
A little bit about RPI Consultants. We are a services firm. We have over 80 plus, and this is a growing number as well, full time consultants, project managers and technical architects. We have offices located in Baltimore and Tampa and right here in Kansas City, Missouri.
Our services range from technical strategy, managed services, health checks, solution designs, implementations, maybe just a one off script as well as upgrades. And we are a licensed partner reseller for the following products, software services. Perceptive Software, OnBase, Brainware by Hyland, Kofax, as well as Infor Lawson.
So a little bit about AP reporting and what it is. If you’re logged onto this webinar right now, if you’re watching this video, essentially you probably have a good idea of the common accounts payable reports that you have to look at. They are important and I’m hoping that this webinar gives you a better idea of maybe some other reports you can use in the softwares that you have to explore that a little bit further and get a little bit more line of sight into your accounts payable processing.
So the first and foremost, senior invoice life cycle. So if you have an AP automation solution right now, it’s important to see where things are and what’s coming down the pipeline, essentially. So you have a good idea of the basically the invoices and the financial impact that’s coming your way. It’s also good for user accountability. So if you have a shared services center that you’re processing invoices through or you have a big AP team or even a small AP team, you can use the user accountability functionality. So basically reporting on security, what user is doing what, for instance, to kind of ID areas of opportunity. Maybe another AP associate has a little bit more learning to do with the software. And you can also get a detailed vendor analysis as well.
So it gives you the opportunity to really identify who you’re paying, how much you’re paying them, and the things that you can do to improve that scenario for your accounts payable department. And there really are many tools available to you to basically run through these reports. And I’ll talk through some of those at the end of the presentation.
So what are some of our common AP reports? These are the ones I’m basically going to run through today. Accrual report all the way through an extraction report. Essentially highlighting different areas within your accounts payable department that can help you make better decisions, help you process things faster, get maybe better rebates and things like that.
So the first and foremost is the accrual report. If you are a Perceptive Content customer that has maybe worked with us before or had an implementation with an AP eForm, you’re probably very familiar with the accrual report. Essentially this is a CSV extract that gets spit out. Basically highlighting everything that’s in flight in your accounts payable solution that needs to be paid within a certain accounting period. So it gives you line of sight into your quarterly and year end close. So if you look at this, what we’re basically doing is taking data and this is at the GL level as well, your general ledger account level.
For things that need to be posted or paid that, as you’re approaching your month end for instance, you want to see what the financial impact is here. So typically in an accrual report you can highlight your company, your cost center, count number, expense type, the financial impacts, the amount for instance of a particular invoice.
So how much of an invoice line. So if half an invoice is going to a certain account, for instance, you can see what the financial impact of that account is going to be. And you can also kind of see where it is in the workflow queue as well. And more importantly you can break it down here by the account or cost center and how much is getting charged to them. So we basically do a summation at the end to see how much money is going to impact your bottom line within the specific period of time.
If you think of it from a resourcing standpoint, it’s also a good report to run too to kind of see like, “Hey we have a lot of stuff coming down the pipeline. We have a lot of things. We’re five days away from close, we have this many invoices in flight and we need to post this because it’s year end.” So maybe planning, resourcing, asking people to say, “Hey maybe can you stay a couple extra hours longer to help us get this done?” There are various methods of output as well. So again, this one is a lot of data and a lot of details, but you can take that data, you can plug it into something like Tableau and upload it and make it pretty. There’s also opportunities within Yoga, the dashboard, and you’ll see a screenshot of that next, that will essentially give you opportunities to display that in a different format if you like.
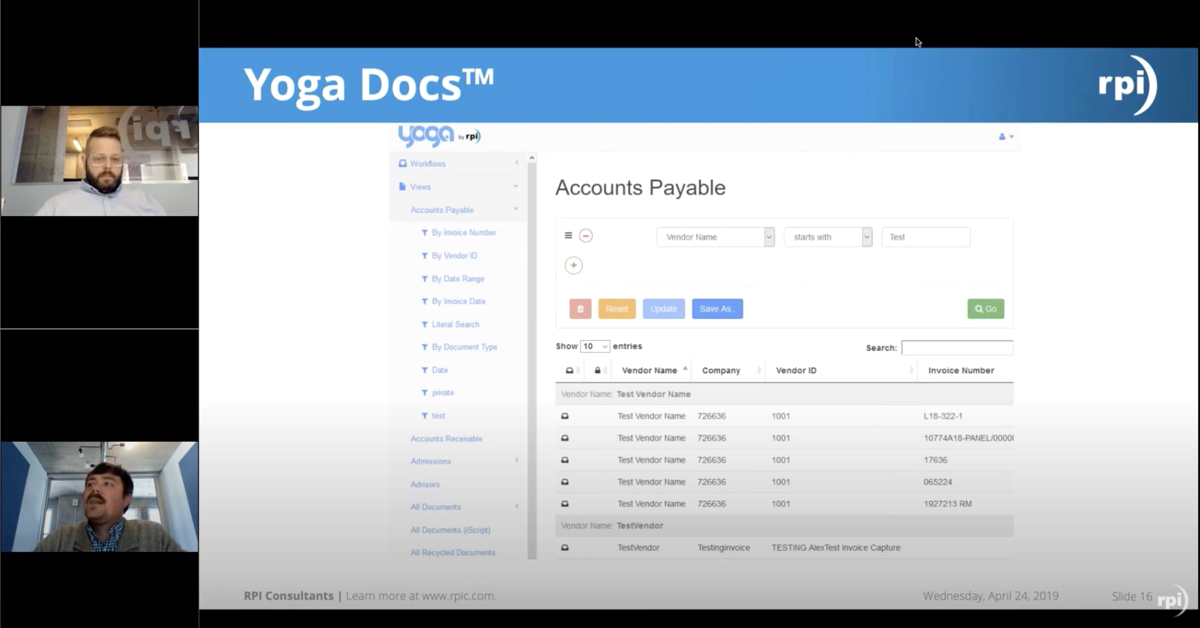
So the next one is the invoice life cycle snapshot. So this is really, if you have an accounts payable solution in place right now, this is a good opportunity to get a snapshot of everything that’s in flight again.
So similar to the accrual report, this is going to give you more of a solution based aspect, or solution based view, essentially, of everything that’s in flight. So what we’re looking at here is basically Yoga. Yoga Docs, the dashboard that’s involved with that. If you put that on top of a workflow process or let’s say an accounts payable workflow process right now. You can identify key areas of where docs are, how long they’ve been there, what the oldest invoice is in that particular queue, and identify areas where you can kind of move things along. So you’re trying to pinpoint bottlenecks within your solution itself.
So maybe if it’s sitting with an approver for more than 10 days or 20 days, for instance, you can essentially use this report, this snapshot report, to drill down, identify those invoices specifically, and basically send a correspondence to that person to move it along and say, “Hey, you’ve been sitting on this approval for a long time.” Approvals can obviously be kind of a headache for a lot of people. So a snapshot report like this will give you the opportunity to see everything that’s in flight and move it forward through your workflow solution.
It’s also good to identify areas where maybe a lot of things are failing potentially, and you don’t know why. You can use that opportunity to identify…so, if it’s in an exception queue, for instance, you can say, “Why do I have 20 documents in here and the oldest one is from two months ago?” Let’s go in and investigate and see why that’s happening.
This next one is a little bit more manager of finance focus, VP of finance focus. Your vendor analysis report. So who are you really paying the most? So this gives you the opportunity to basically see the vendors that you use the most and who you’re basically paying the most. So this is a great report to run and this one comes from KTA. They’ve got a lot of great out-of-the-box reports for invoice processing. If you would like to see a demo of that, we’d be happy to do that.
But essentially gives you a snapshot of how much you’re spending. So you take this report, you see how much, this one for instance, this is your top 10 suppliers by early discount value. So if it’s flagged as a vendor that has an early discount value, you want to make sure that’s in your system so you can kind of track that metric. And then you can track their spend that you’ve been doing with them.
This gives you the opportunity to basically say, “Hey, let’s go to the table. We’ve spend over a million dollars with you in the last nine months, for instance, for an organization. Can we get a better rate? We want to continue to work with you. Let’s use this opportunity to get a better rates or some kind of discount. Things like that.
It’s also an opportunity to look at your vendor spend and say, “This vendor’s just not working out and we are spending a lot. Let’s go explore other vendors potentially to either supply that service or that part for instance.” And kind of get a better idea of what your options are as a manager to control your spend and where that’s going.
The next one is targeted invoice processing. I like this one quite a bit. Urgent invoice processing is kind of a big deal. In a lot of the solutions we try to set up a scenario because a lot of accounts payable departments that we work with have a scenario where, well if I’m sending it to OCI and it’s going to go here, that’s a day or two and then it’s got to go through validation and maybe approvals, things like that. But you just have that vendor that has to be paid.
This is a good report to run that’s highly integrated with your workflow solution to identify upcoming due dates for instance, and get those processes paid. So essentially if you are looking at this report, you’re trying to identify maybe the inverse amount that’s in this column here. And again, this can obviously be moved. Who’s in charge of that particular invoice, who it’s sitting with currently and what the approaching due date is.
So if you’ve got these vendors. So, similar to the previous report, that these guys give us early payment discounts. If we’ve got these due dates coming up, let’s focus on these. So you as a manager, you can guide your AP clerks or AP associates to process these invoices, make them a priority when they come into work on a Wednesday, for instance, and say, “Let’s get this one through the system faster.” Than some of the others and then continue on with your work.
Another good report is just the daily throughput. So this is essentially you take a snapshot of a timeline. So it can be that or it could be over a week or over a month, but essentially you’re trying to identify how long it takes to process an invoice through your system.
So if we take a look we take a look at this report itself, you can kind of track the metrics on a day-to-day basis essentially. Or a week-to-week basis. On how many you’re processing through your system. How long it takes essentially to get an invoice process.
So maybe you’d get all of your invoices at the first of the month or the middle of the month and you see an influx. And how long does it take to get them through your accounts payable solution? So one thing I actually really like about this is if you have a full AP automation solution with some kind of an OCR technology like Brainware or Kofax TotalAgility or Readsoft Online, you can kind of track how many of those invoices you didn’t have to touch.
So this is a great example. If you have a heavy on the purchase order invoices with a lot of materials, for instance that come in, it goes through the OCR extraction process. No one had to verify it or touch it or correct any fields.
And how many of those invoices went into workflow for instance, and no one had to do anything? It just automatically got posted to SAP or posted to Lawson or any accounting system, really. Tracking your touchless invoices essentially is the verbiage that’s used in this particular report. Tracking that is a great way to say, “Hey, we are really realizing our return on investment. Or ROI is pretty high here. Let’s see how we can make it even better.” But it’s also a good opportunity to say, “We are having to touch so many invoices. Let’s track this and see ways that we can improve it and dig down a little bit further.”
Another good report is the spend by department. This is probably one that most AP managers are familiar. It’s just kind of identifying which departments within your organization are spending the most money. What’s really important about this is taking in the metric, or taking in the data element of your actual budget.
So if your HR department, for instance, and this one jumps out first and foremost to me. You’ve got your planned spend, how much you actually spend, versus your unplanned spin. So it gives you, as an AP manager, a good opportunity to identify areas of…or essentially benchmark. Here’s what our budget was. How much over is that unplanned versus planned spending? Essentially.
It gives you areas of opportunity to identify, hey, if one department’s not spending so much money, maybe we have an opportunity to automate things there or to invest a little bit more into that organization or that department to improve things a little bit. But it’s also an opportunity to identify areas of overage.
For this HR example, for instance, maybe there’s a lot of organizational changes and a lot of payouts are having to go out. It’s a good opportunity identify why is that happening? How can we control that spin essentially and kind of work it forward so you can stay a little bit more on budget for your fiscal year.
And the last report I’ll talk about here is an extraction report. So a lot of extraction reports exist within Kofax TotalAgility, the Kofax module essentially for extraction, Readsoft Online, as well as Brainware Visibility by Hyland. I’ll show a screenshot of that here in a second. But this is really for your OCR solutions.
So, if you have an OCR solution in place where you’re pulling data off an invoice document or you’re thinking about exploring one, there are great reports to help you use and we find a lot of times the clients aren’t using these very much. It’s a very underutilized tool that really needs to be explored because it is still, even though it is software specific, it is very AP specific when it comes to the areas where you can improve and greatly automate your invoice processing.
So this report here kind of gives you a snapshot of the field specific that are being extracted off of an invoice document. So this is specific to Brainware by Hyland. So basically you’re reading through the invoice document, the system is reading through the invoice document, grabbing the values and it’s highlighting how many of those values are correct.
78% of the time, did we get the invoice amount correct or did someone have to verify that or correct it? Or this one, 86% for the invoice date. It’s getting that most of the time. And this reports great to run and this is an out-of-the-box report that can be run to, basically, say for my OCR solution itself, we are getting great extraction rates, if it’s maybe not so great, and you can set that threshold, essentially you can highlight it in yellow or red, and identify areas on an invoice document that say, we just aren’t getting that value.
What plan can we put in place? Does it require more training of the OCR technology or does it require us to talk to the vendor or do we need to just not attract that value altogether to basically improve that? Essentially you’re looking at this and you’re saying how many times does my user have to touch this specific value on our invoice documents.
Extraction reports can often run vendor specific as well, so you can identify your top 10 vendors, see which ones have the most trouble and maybe you can set up a learn set or some kind of rule in place for those vendors to get those values.
So those are some of the common reports that we like to run, that we like to see, that we find that are very beneficial to a lot of accounts payable departments and finance managers essentially. But I do want to talk about the difference between the standard report and a customer report.
So essentially standard reports, these are the ones that are just going to come out-of-the-box. So if you had Perceptive, OnBase, Brainware, Readsoft Online, Kofax, you essentially have a lot of reports that come out of the box. Some are really good to use. I know Perceptive, I work with quite a bit with those reports as well as KTA. Those reports are great at showing your workflow analysis and highlighting certain things. But they not show certain key values that are really important to you. Like I wish that it would show this or I wish it would show invoice date or due date or I can filter by this type of thing.
And that’s where you kind of jump into the realm of custom reporting. We get a lot of requests for custom reports and oftentimes that is something where there’s an existing report and the client says, “Hey, I really like this report. I just wish it had this data or I wish I could filter it on this.” Keep in mind with custom reports, this is something that’s going to require some kind of development cycles.
So whether you do this in house or you use a third party, like RPI for instance, you’re going to have to go through requirements gathering, you’re going to have to go through development, you’re gonna have to go through testing, and eventual deployment to production.
These can also be done just on a whim when it comes to, “I just want this report that says that this.” There’s a lot of options for that, including the output itself. So Yoga is a good example where a client had a need to see a historical analysis of a report and just see how many things have processed through the system over a given time and how many was approved or rejected type of thing. Completely custom report that we can essentially push out and write within our system. But they can also be done within KTA, within Perceptive, within OnBase as well as Brainware.
So kind of wrapping up this Webinar now. Talking about some of the reporting tools and software. Just a quick highlight of what those are and the verbiage themselves around what those reporting softwares are. We have You of Kofax Insight. Kofax Insight is a great tool. There’s a main dashboard where you can get a lot of your metrics kind of stood up and the most important things that you need to see. It’s also got a good accounts payable workflow processing reporting module as well.
It’s kind of more specific, more financially minded. Perceptive Business Insight is great for workflow and user analysis as well where you can basically see how many documents are being processed. It’s great for identifying security. So if you go through several audits for instance and you need to do it, there’s a lot of reports built within Perceptive Business Insight. So I kind of identify what the security items are, what the security is for your invoice processing and kind of identify key weaknesses potentially. And it does run on Cognos.
Brainware Visibility. This is kind of the last screenshot that you saw. It is extraction based reporting. So really it is centered on the software itself, but based on the data and the project file essentially for Brainware, you can identify areas where you can improve your invoice processing. Like the vendor specific reports to identify areas where you could make changes within the system if you need to. If you’ve been processing for like a year for instance or more, you identify areas to kind of improve that extraction process.
And then Hyland Business Activity Monitor. This is kind of similar to the Perceptive Business Insight as well, whereas document centric reporting with a great workflow analysis and user analysis to kind of see what’s going on in your system, what you’ve processed, what’s in flight, things like that.
So in summary there are a lot of reports. This by no means is an all-encompassing webinar about financial reporting with accounts payable. But it does give you an insight into how you can identify key areas of good reports that you could run. I had a whole list that I wanted to cover. It’s a lot of slides if you do that.
So if you have any questions, now is the time to ask them. So, no questions. Essentially, I really encourage you guys to check out some of our other resources. We’ve got a knowledge base here on our rpic.com/knowledgebase with a lot of articles and updates that we try to update as frequently as possible to help you troubleshoot common issues that we see. Yoga, which I mentioned earlier, the dashboard itself, if you want to see what that dashboard looks like or see a past webinar on that, you can go to either the Yoga Flexible Software site or our past recordings to see some of the other content that we’ve put out over the last few years. Thank you guys very much.